Schedule


DAY 1: Monday 27 January

9 AM Opening Talk, Mike Riversdale
9:30 AM Finding Stories in Data:
Exploring figurenz data
10:30 AM Morning break
11 AM What makes a good story? Sydney Shep
12:15 PM Lunch
1:00 PM Tool Talks
2:15 PM Intro to data sets and search tools
2:30 PM Afternoon break
3:00 PM Project pitches & team formation
4:30 PM Day 1 wrap-up

DAY 2: Tuesday 28 January

9:00 AM Kickstarting the storymaking
9:30 AM Hack
11:30 AM Check In (Teams share challenges/opportunities)
12:15 PM Lunch
1:00 PM Hack!
3:15 PM Project Presentations
4:30 PM Prizegiving
4:45 PM Wrap up


Data sources


Figure NZ
Accessible aggregator of standardised data relating to New Zealand.
data.govt.nz
Data.govt.nz helps people discover, learn and use open data easily; empowering, enabling informed decision making, and problem-solving for citizens and business alike.
Index New Zealand
Index New Zealand is a searchable database that contains abstracts and descriptions of articles from about 1000 New Zealand periodicals and newspapers published from the 1950s to the present day. The periodicals range from academic research journals to magazines. Around 3000 new records are added monthly from 460 current titles.
Digital NZ
Aggregator of digital content relating to New Zealand, with a focus on, but not limited to, the cultural sector.
Google Dataset Search
Google search aggregator of datasets from around the world.
Migration Data Explorer
This is the public version of the Migration Data Explorer, developed for Migration, Evidence & Insights, Ministry of Business, Innovation and Employment.
OECD Data
Find, compare and share the latest OECD data: charts, maps, tables and related publications.
Australian Open Data
Find, explore and reuse Australia's public data.
USA Facts
USAFacts is a new data-driven portrait of the American population, its government’s finances, and government’s impact on society.


Tools


KNIGHTLAB Toolsuite

Innovative suite of open-source, adaptable, and lightweight tools for media makers and storytellers. Create interactive narratives with a focus on data, time or location from scratch - elegantly and easily.

Twine

Twine is an open-source tool for telling interactive, nonlinear stories. You don't need to write any code to create a simple story with Twine, but you can extend your stories with variables, conditional logic, images, CSS, and JavaScript when you're ready.

ToPāN

ToPān is Topic-Modelling for everyone: from people without programming knowledge to people that want to build teaching and text-reuse tools and apps based on Topic-Modelling data without having to develop their own tool or having to majorly restructure their textual data.

Jupyter Notebooks

JupyterLab is a web-based interactive development environment for Jupyter notebooks, code, and data. JupyterLab is flexible: configure and arrange the user interface to support a wide range of workflows in data science, scientific computing, and machine learning.

Power BI

Find and share meaningful insights with hundreds of data visualizations, built-in AI capabilities, tight Excel integration, and prebuilt and custom data connectors.

OpenRefine

OpenRefine is a powerful tool for working with messy data: cleaning it; transforming it from one format into another; and extending it with web services and external data.

Hypothesis
A conversation layer over the entire web that works everywhere, without needing implementation by any underlying site. sentence-level note taking or critique on top of news, blogs, data visualisations, scientific articles, books, terms of service, ballot initiatives, legislation and more.
QueryPic
QueryPic provides a new way of seeing, searching and understanding the digitised newspapers made available by Trove and Papers Past. Follow changes over time. Map trends and patterns. Follow a hunch. Frame a question.
Glam Workbench
Here you’ll find a collection of tools and examples to help you work with data from galleries, libraries, archives, and museums (the GLAM sector), focusing on Australia and New Zealand.
Webscraper.io
Web Scraper can extract data from sites with multiple levels of navigation. It can navigate a website on all levels.
Piktochart
Simple, intuitive tool that helps you and your team tell stories with the visual impact they deserve. (Paid service, free tier available).
Data Illustrator
Online tool to create infographics and data visualizations without programming. A research collaboration between Adobe Systems Inc. and Georgia Institute of Technology.
Instant Atlas Report Builder
Design and publish any type of report on ArcGIS Online from simple snapshots to complex, multi-page area profiles, producing desktop-publishing quality, complex and highly-interactive atlases, dashboards and reports.(Paid service, free tier available).
Palladio
Visualize complex historical data with ease.
 

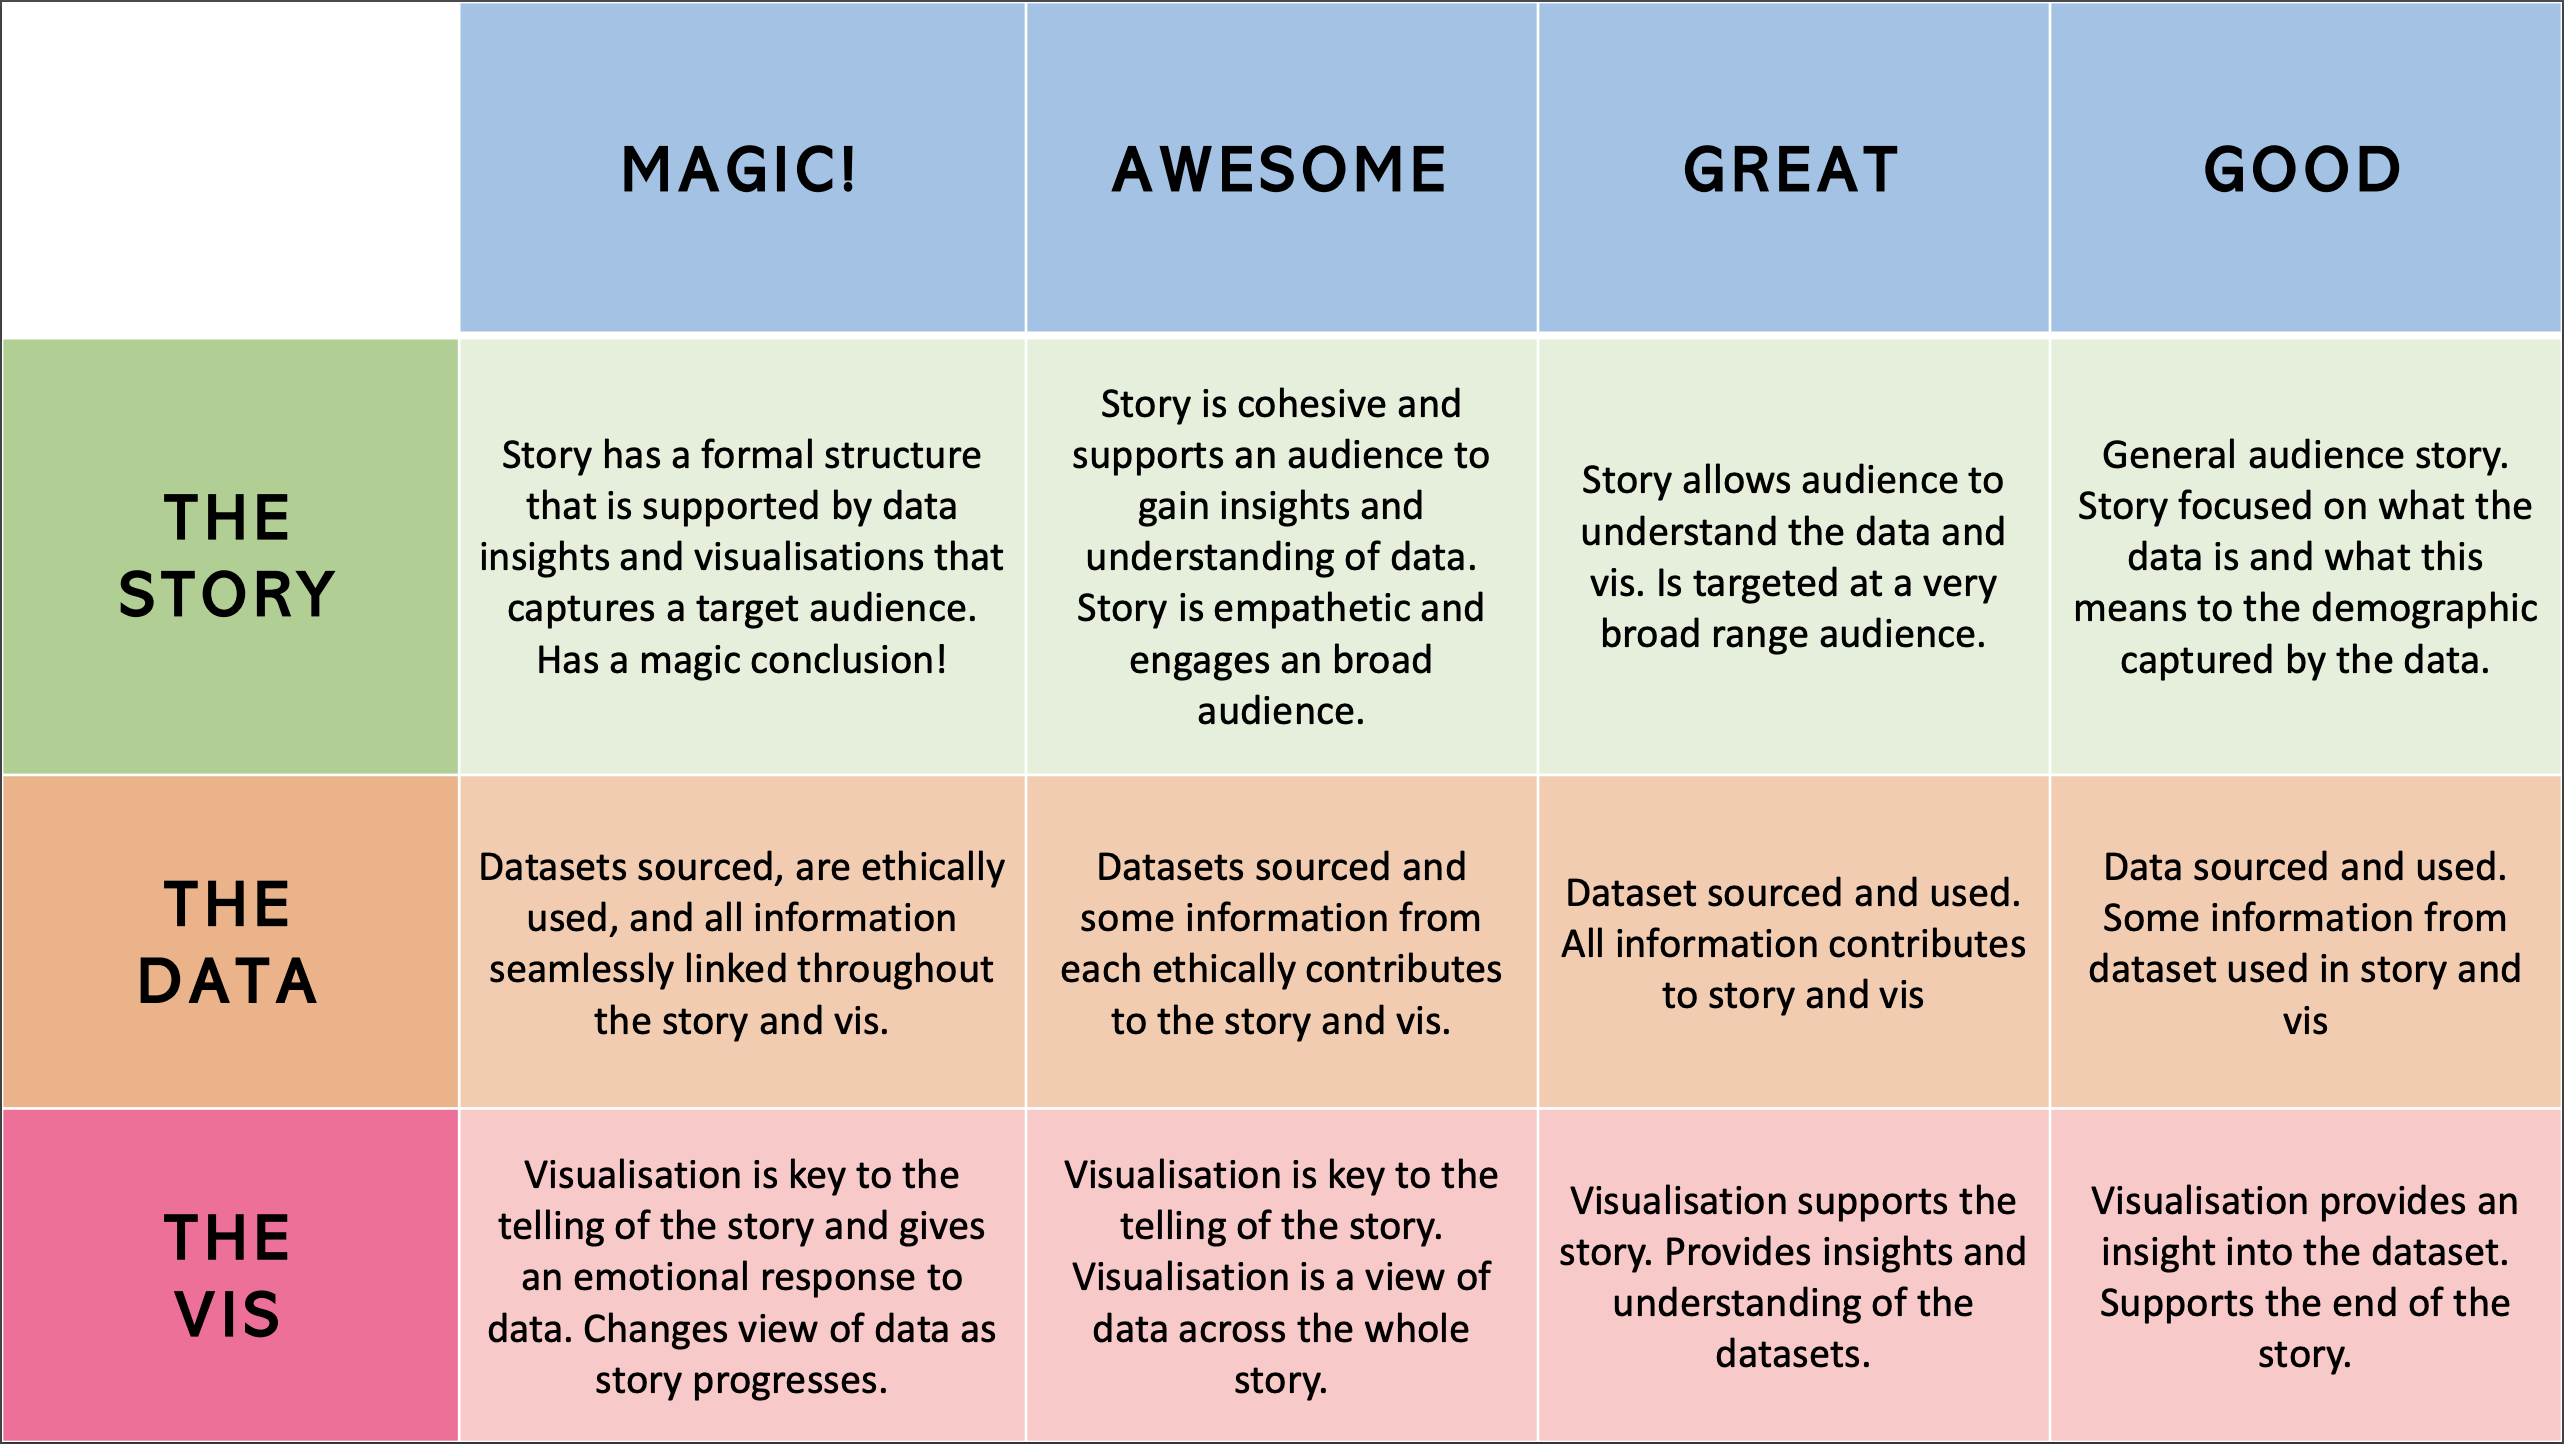
Marking Rubric


Presentation Guide


UPCOMING EVENT - FEBRUARY 27-28, TTR205


Software Carpentry aims to help researchers get their work done in less time and with less pain by teaching them basic research computing skills. This hands-on workshop will cover basic concepts and tools, including program design, version control, data management, and task automation.
Register here.


SLIDE PRESENTATIONS


Figure.NZ
Figure.NZ CEO Ngapera Riley's slides from her Hackfest presentation (click on the link to the left to download).


Photos